
I led the design of a Support Dashboard for an internal support team to streamline support ticket management within the organisation, providing critical insights through a user-friendly interface built using Figma and implemented in Power BI. This initiative aimed to enhance visibility of operational performance, facilitate effective resource allocation, and improve user satisfaction within the company's internal support functions.
Note: Only placeholder information is displayed within the UI shown below.
As the lead designer for this dashboard, my responsibilities included initial concept creation, detailed UI design, and multiple iterative improvements based on user feedback. I conducted usability tests directly with end users, collaborated with Power BI developers, QA specialists, support agents, and managers, ensuring the dashboard met operational requirements and delivered clear, actionable insights.
During the ideation phase, I first researched data intensive dashboards and design limitations for PowerBI. Then, I conducted extensive stakeholder consultations, including meetings with support agents, managers, and senior management. I mapped user journeys to identify essential functionalities and data points required for effective management. I also facilitated data collection, identifying necessary data sources such as ticket details, employee assignments, and user feedback, primarily sourced from SQL databases and internal reporting systems.
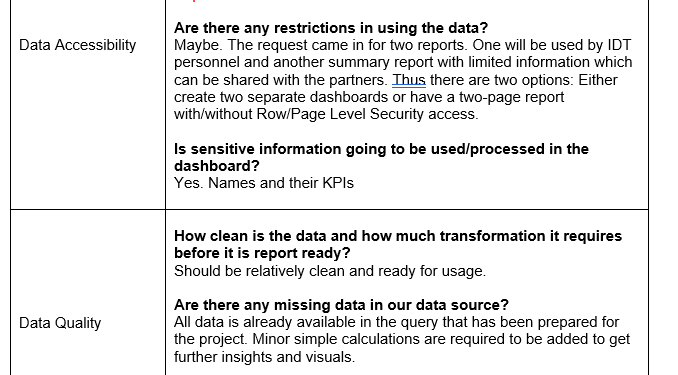
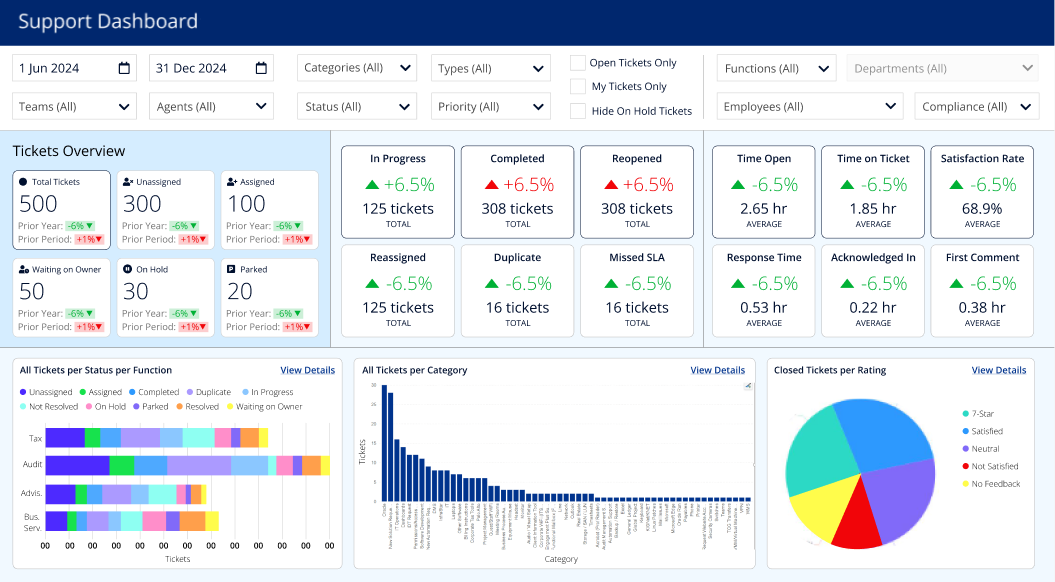
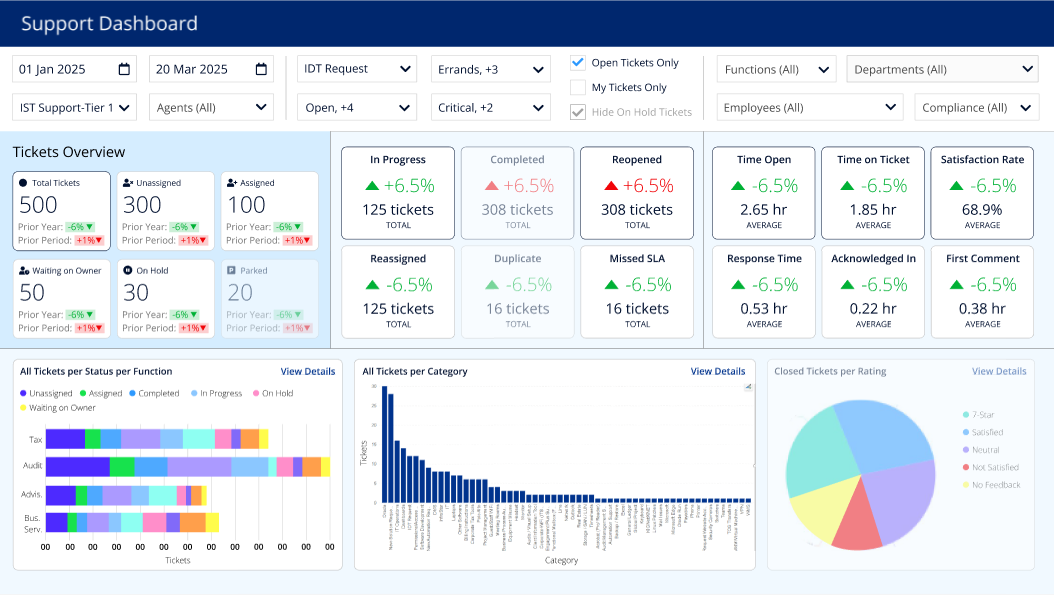
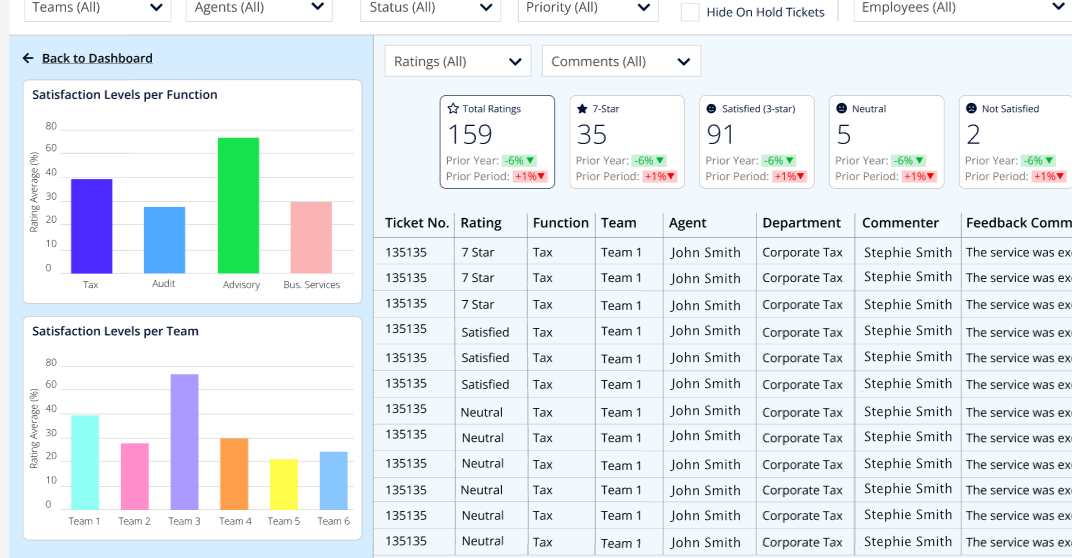
Using Figma, I created an interactive and intuitive UI with clear navigation and comprehensive filtering capabilities. My key design considerations included clarity, ease of use, and quick access to critical data points like ticket statuses, SLA adherence, and user satisfaction ratings. I conducted multiple design iterations, incorporating continuous stakeholder feedback and usability testing to refine layout structures, visual hierarchy, and interactions, resulting in a highly functional and visually coherent design.
Following the final design approval, I collaborated closely with Power BI low-code developers, QA team, and support agents and managers to implement the dashboard. We leveraged Power BI’s robust data modelling and visualisation capabilities. Extensive testing ensured data accuracy, performance under various data loads, and adherence to security requirements through Row-Level Security features. I conducted User Acceptance Testing (UAT) to validate user satisfaction, ease of use, and effectiveness in real-world scenarios. Post-UAT, I supported the creation of documentation for ongoing maintenance and user training to ensure smooth adoption across teams.
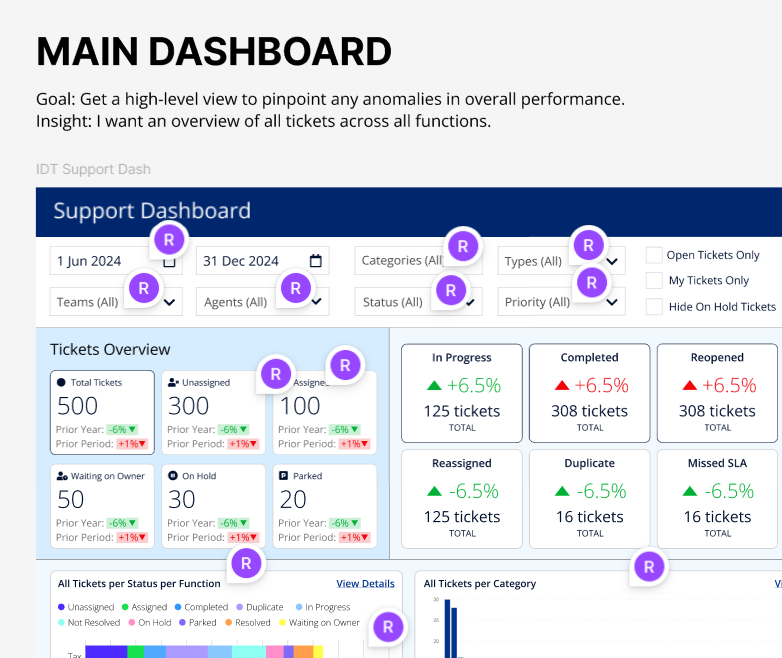
The deployment of the dashboard provided valuable insights including:
Future enhancements planned for the Support Dashboard include:

