
I designed and integrated the Finance Debtors Collection Dashboard within the finance module of the existing internal tools of a company to give their finance team a unified view of debtor balances, lockup metrics, and work-in-progress (WIP) days across functions and departments. Using Figma for prototyping and an in-house analytics platform for implementation, I delivered an interactive tool that optimises collections and cash flow management.
Note: Only placeholder information is displayed within the UI shown below.
As the lead designer, I:
The finance team struggled with fragmented data sources and lacked real-time visibility into debtor ageing and WIP metrics, resulting in inefficient collections and impaired decision-making. The objectives were as follows:
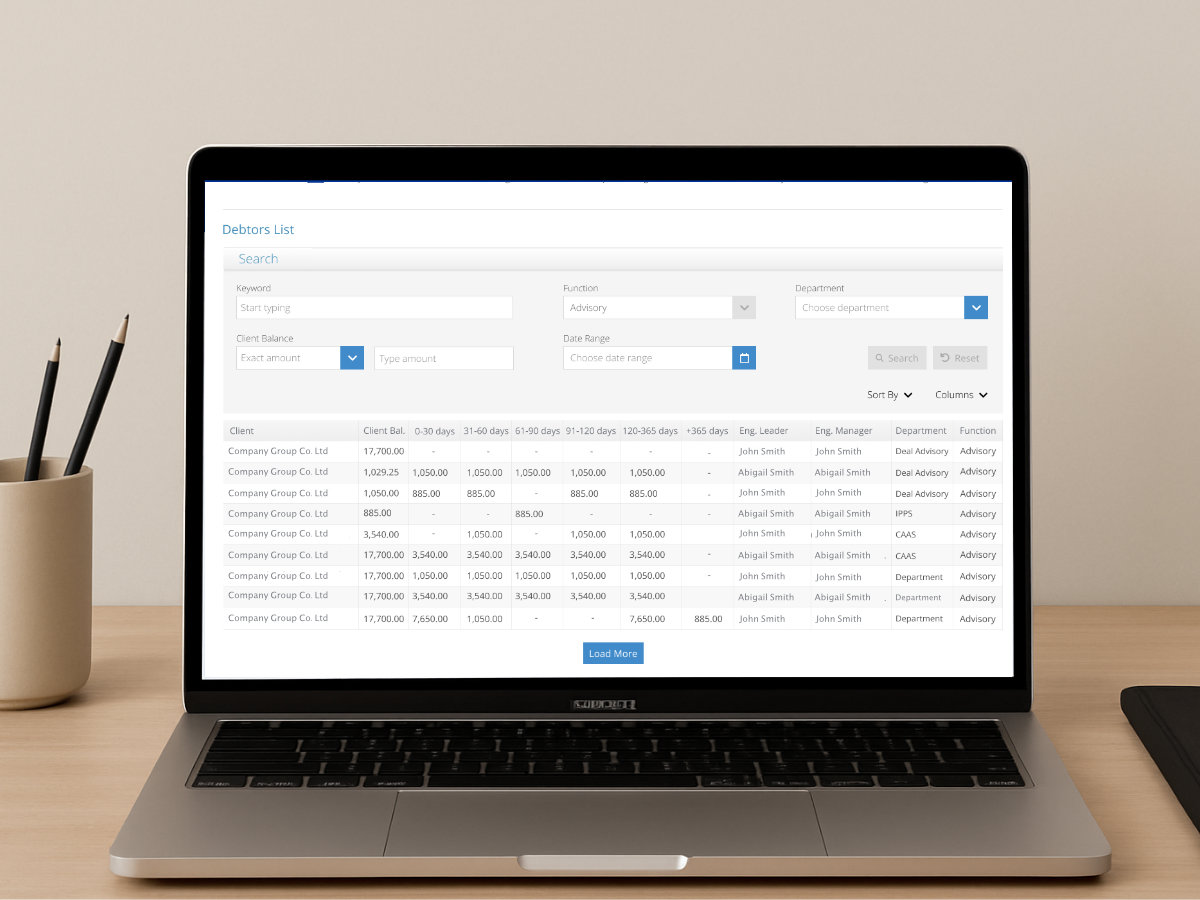
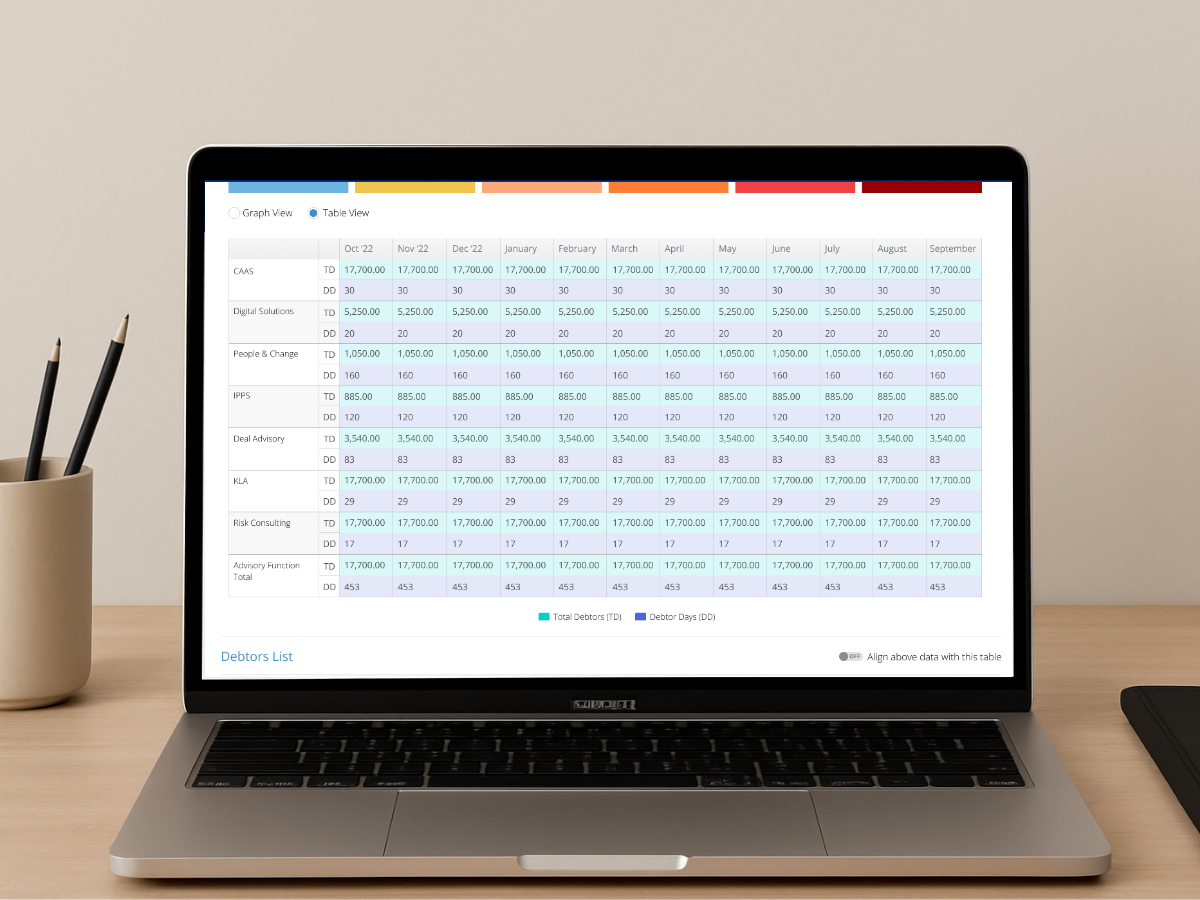
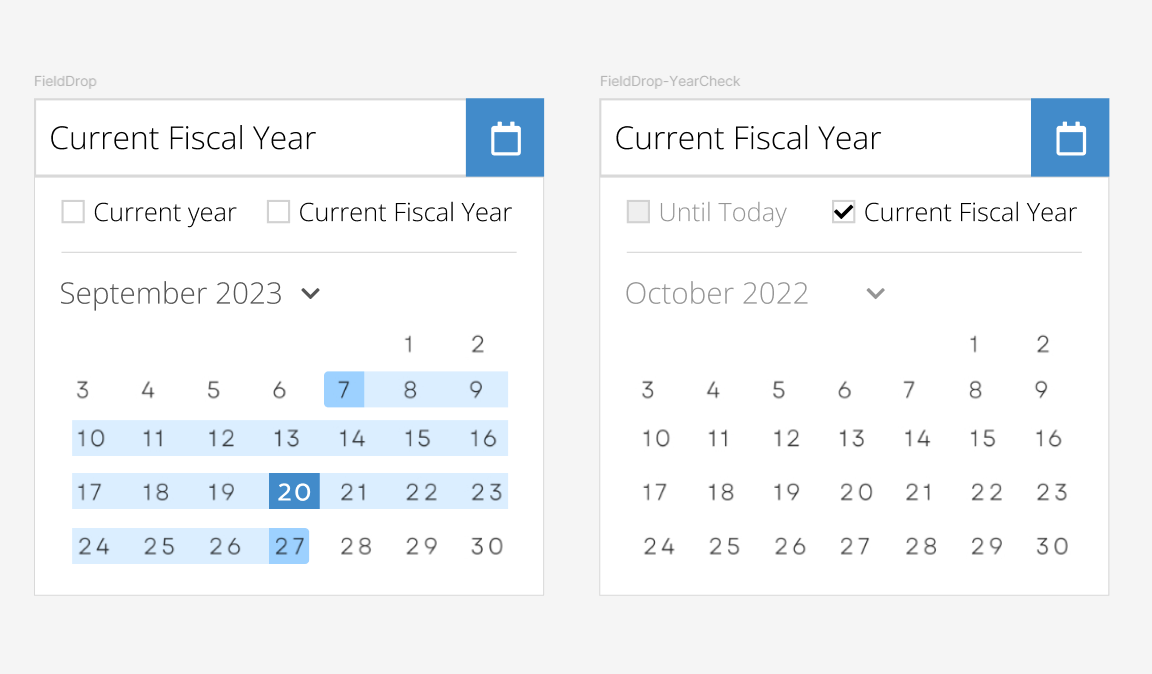
The existing reporting process relied heavily on Excel spreadsheets, with stakeholders manually maintaining and updating complex formulas (e.g., SUMIFS, AVERAGEIFS, and custom calculated fields) to track debtor ageing and WIP metrics. To streamline this, I worked closely with accountants, finance advisors, finance managers, the head of finance, and our in‑house data analyst to map out these Excel calculations and translate them into a centralised data model. We implemented ETL processes and calculated metrics within our analytics platform to replicate spreadsheet logic. The resulting navigable dashboards feature tabular views and intuitive filters, enabling easy report extraction by fiscal year, department, function revenue, and individual debtor—all without manual spreadsheet maintenance.
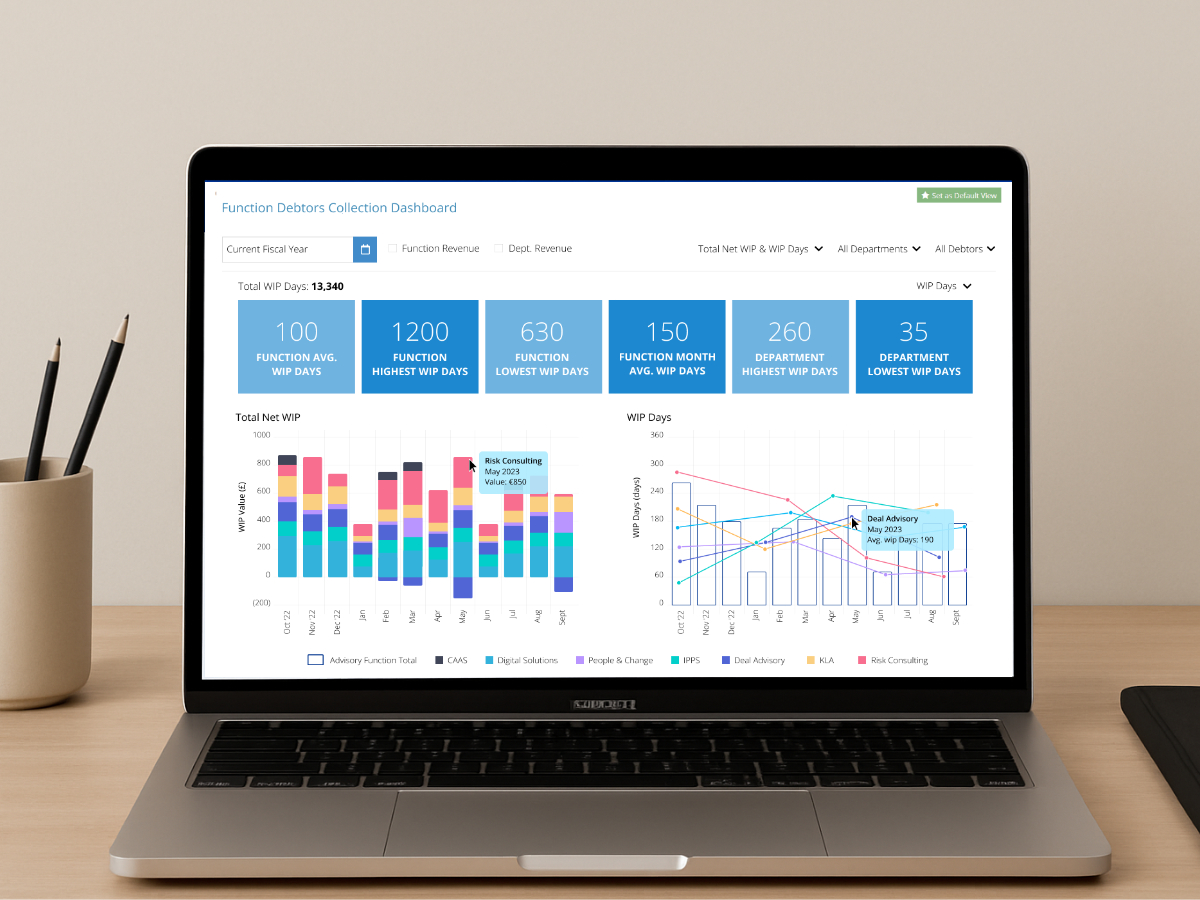
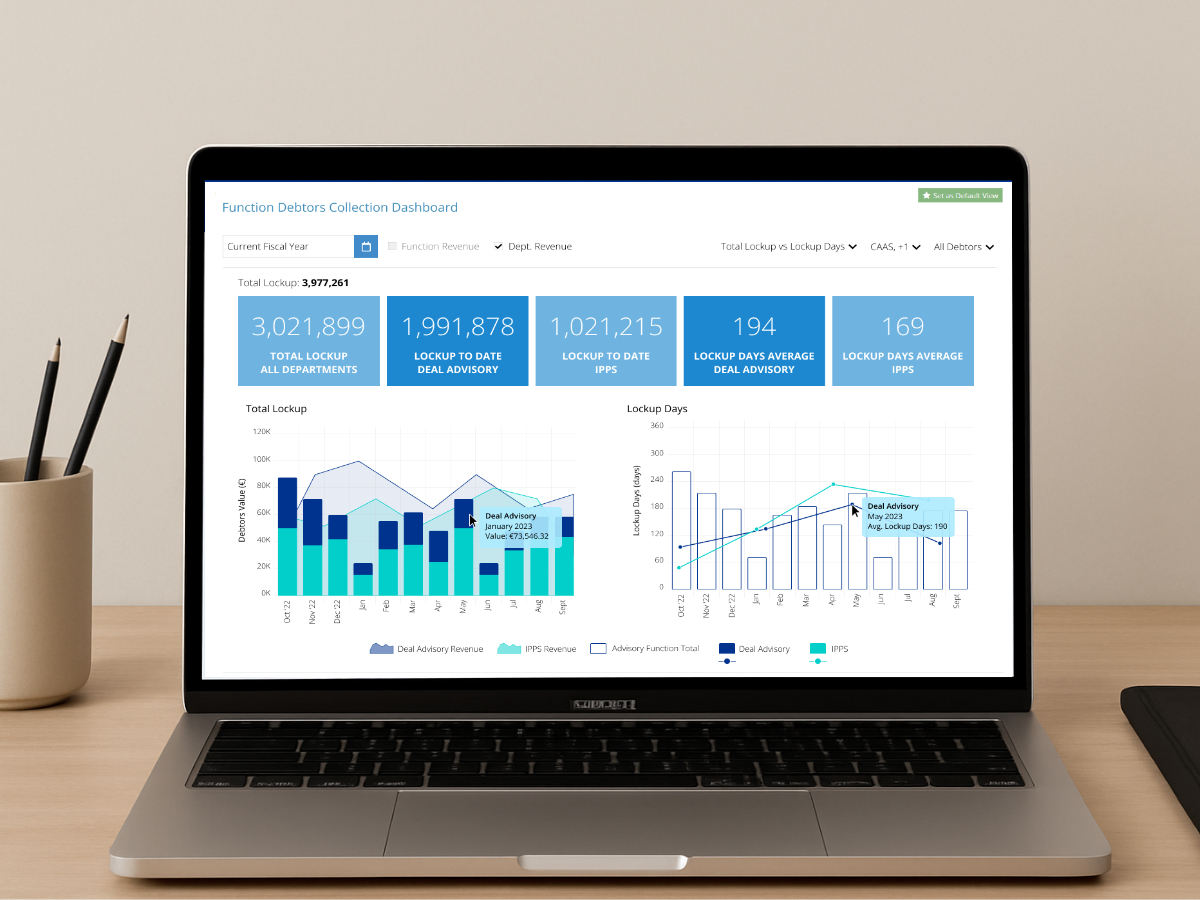
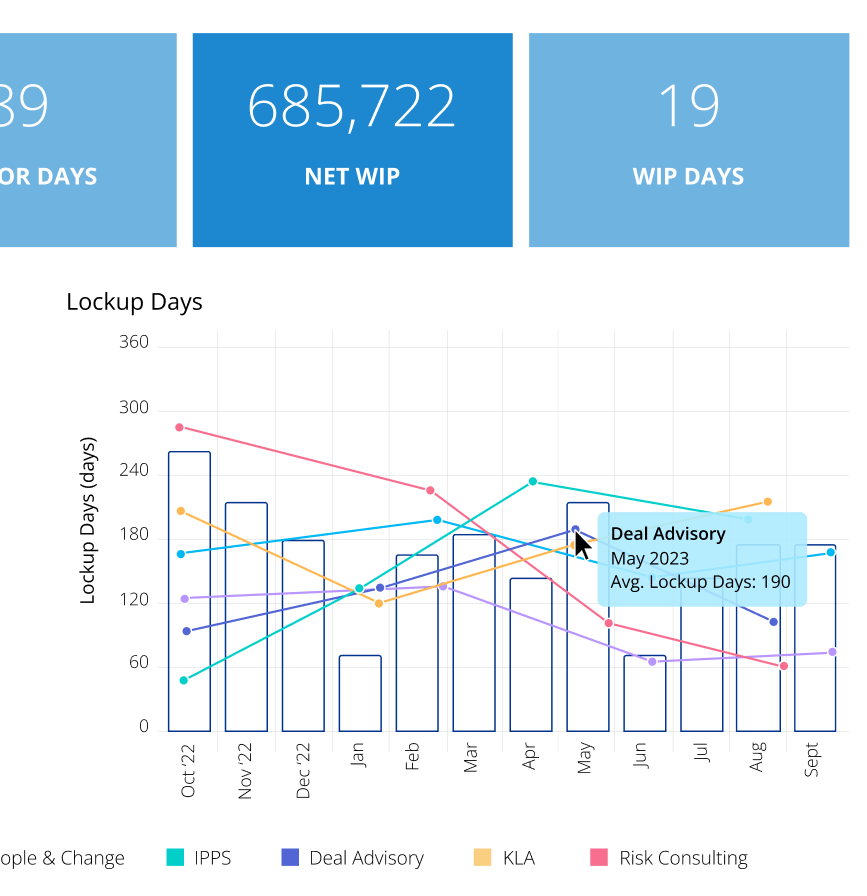
In Figma, I prototyped KPI card layouts displaying totals for lockup, net WIP, and average WIP/lockup days. I designed combined bar and line charts to reveal trends at both the function and department levels. Interactive slicers and drop-downs enabled dynamic filtering. After two rounds of stakeholder review and usability testing with accountants, finance advisors, finance managers, and the head of finance, I refined colour contrast, tooltip details, and responsive behaviour.
Implementation and Validation: Once the design was finalised, I collaborated with our full-stack and back-end development teams to implement the centralised data model, ETL pipelines, and visual components within the internal finance module. We optimised SQL scripts and data transformations for large datasets, and configured role-based access controls (row-level security) to ensure data privacy. I coordinated a QA cycle with the QA team to validate data accuracy, filter functionality, and performance under load. During User Acceptance Testing (UAT), I guided finance stakeholders through drill-through scenarios and export workflows, capturing feedback and making final adjustments.
The Finance Debtors Collection Dashboard addressed critical visibility challenges, streamlined collections processes, and empowered the company's finance team with actionable insights. This project not only improved operational efficiency and decision-making but also established a scalable framework for future analytics enhancements.

